| |
IPJudo Manual
To navigate this online manual, use the links to the right to
jump into the web page below, or just scroll down to browse the
entire manual.
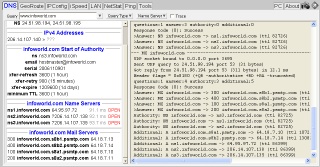
 To perform detailed DNS lookups/queries (nslookup), use the DNS tab.
Quick Start: Enter the name of your web site in the query field
and press 'Enter' on the keyboard.
The down arrow accesses a most recently used list.
Query:
In the 'Query' text field, enter a host name (like 'www.ipjudo.com'), a domain name
(like 'ipjudo.com'), or an IP Address (like '217.160.232.50'), and press 'Enter'
on your keyboard. Optionally select the 'Query Type' and 'Name Server' (below).
See the DNS results nicely formatted in the left-side panel with the detailed query
results in the right-side panel.
Results (left pane): The left pane displays a summary of the query and the query results. For
an 'Automatic Detailed Query', you will see
(1) a summary of the query,
(2) alias (CNAME) for the name (optional),
(3) any IPv4 and IPv6 address mappings,
(4) the SOA for the domain,
(5) the name servers (NS) for the domain, and
(6) the mail servers (MX) for the domain.
Details (right pane): The right pane displays a very detailed log of the DNS
queries and responses.
Query Type Choice:
In most cases, the query type should be left set to 'Automatic Detailed Query', which will
automatically perform a detailed series of queries based upon your input query. Otherwise,
select the specific type of query you want to perform from 'A', 'NS', 'CNAME', 'SOA', 'PTR',
'MX', 'TXT', 'AAAA', or 'ANY'.
Name Server Choice:
In most cases, the name server should be left set to 'Automatic', which will automatically
use the name servers currently configured for your Internet connection. Otherwise,
you can select any DNS name server to query via the 'Customize...' menu item.
Trace Checkbox:
When the 'Trace' checkbox is selected, DNS queries will be made with the RD
(recursion desired) bit turned off. Recursion will then be implemented internally,
with the list of name servers queried displayed for your review.
|
Open Name Servers: IPJudo will automatically detect 'open' name servers.
When you see OPEN after a name server, that indicates an
open name server.
open name server is an authoritative name server for a domain that also responds to
public DNS queries. It is an Internet best practice that the authoritative name servers
for a domain do NOT respond to public name queries. For example, perform a query on
'infoworld.com' or 'esedona.net' to see open name servers.
|
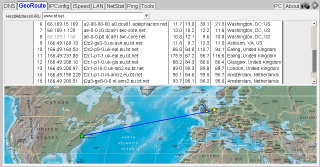
To perform detailed GeoGraphical trace routes, use GeoRoute.
Quick Start: Enter the name of your web site in the text field
and press 'Enter' on the keyboard.
The down arrow accesses a most recently used list.
Host/Address/URL:
Enter a host name (like 'www.ipjudo.com'), IP Address (like '217.160.232.50'), or URL
(like 'http://www.ipjudo.com') and press Enter. Results will be displayed in just
seconds in the table (upper panel) and displayed on a world map (lower panel).
Table (upper pane):
The table will show the trace route detail hop by hop from your location to the
destination location.
| Hop | An increasing hop number to the destination host |
| IP Address | The IP Address at the hop. Normally black. Gray when IP Address is variable |
| Host Name | The reverse DNS lookup on the IP Address |
| ms1,ms2,ms3 | The three ping samples (in milliseconds) to the hop location |
| ave | The average time (in milliseconds) of the ping samples |
| GeoLocation | The location in the world of this hop location |
Map (lower pane): The world map in the lower panel will display the path taken. The
green star designates the starting (go) location. The red star designates the
ending (stop) location. Yellow dots designate hop locations.
|
Using the mouse in the map:
Click and drag to move the map. Use the mouse wheel to quickly zoom in/out.
Hover over dots/stars for that location in a popup.
|
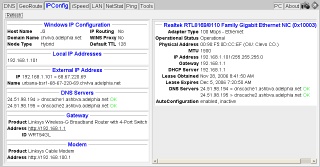
For a detailed display of your IP configuration, use IPConfig.
Quick Start: Press the 'Refresh' button and review the resulting display.
Windows IP Configuration: Displays the Host Name, Domain Name, Node Type, IP Routing,
WINS Proxy, Default TTL information.
Local IP Addresses: Displays the list of (local) IP Addresses assigned to your computer.
External IP Address:: Most client computers are behind a firewall or NAT, so that shows
you what the outside world thinks your IP address is.
DNS Servers: Displays a list of the DNS servers (IP Address) assigned to all adapters
on your computer. Attempts to resolve each IP address to a name, and performs a test DNS
query to each DNS server to verify that it is working.
Gateway: Identifies the gateway that your computer uses to connect to the Internet.
It identifies common brands of gateways and provides a URL to gateway.
Modem: Identifies the cable/DSL modem that your computer uses to connect to the Internet.
It identifies common brands of modems and provides a URL to the modem diagnostics web page.
Adapters List: The entire right panel provides detailed statistics about each
Adapter configured on your computer. Statistics include
'Adapter Type' (Ethernet/FDDI/etc),
'Operational Status' (Operational/Disconnected),
'Physical Address' (the MAC address and OUI mapping),
'MTU' (maximum transmission unit),
'IP Address',
'Gateway',
'DHCP Server',
'Lease Obtained',
'Lease Expires',
'DNS Servers',
and 'AutoConfiguration' status.
WARNING: Microsoft Window's 7/8/etc TCP/IP receive window
"heuristics" are brain dead stupid, don't work properly (kill bandwidth
performance), and prevent TCP/IP buffer sizes from being set
(details).
To turn
heuristics off, run "netsh int tcp set heuristics disabled"
from an elevated command prompt (no need to reboot; just
start a new speed test).
|
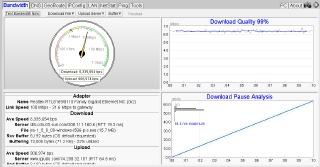
To perform a detailed Internet speed test and Internet connection quality
assessment, use Bandwidth.
Quick Start: Click the 'Test Bandwidth Now' button to test the download and
upload performance of your Internet connection. To customize which Download File,
Upload Server, and Buffer size are used, use the drop down boxes.
Speed Graph (upper left pane): The average download and average upload
speeds are graphically displayed in the graph.
Download Quality (upper right pane): This pane visually graphs the download
quality of your Internet connection. The gray line shows a very fine grained
download speed of your connection over time. The blue line shows a more
averaged download speed of your connection over time.
|
A high quality Internet connection will have a blue line that is almost
perfectly horizontal (flat). The more up/down variation of the blue line means
an Internet connection whose download speed is not consistent.
|
Download Pause Analysis (lower-right pane): This pane visually graphs
the results of the download pause analysis. Each 'pause' is the amount of
time from one data chunk read to the next data chunk read.
|
A high quality Internet connection will have very little variation in
the download pause over time, resulting in a very straight line from
the lower left to the upper right. When an Internet connection starts
to have lots of variation (stops and restarts), you can see the results
visually as the line starts to jump around.
|
Adapter Statistics: The name of the Adapter Windows used for the speed
test is displayed along with its 'Link Speed'. This can be very revealing
in some wireless adapter situations, where the wireless link speed is the
speed bottleneck, not your Internet connection. Also, an estimate of the
speed to Gateway is displayed, which should always be 'high' relative to
your Internet speed. A low speed to the gateway may indicate a congested network.
Download Statistics: The download speed, server, ip address, RTT, file,
and buffering are displayed.
|
Of note is the 'Rcv Buffer' and 'Buffering'. Under older versions of Windows,
the TCP/IP buffer size was very important to actual bandwidth. However, under
Windows 2000/XP/2003/etc, Windows now 'tunes' the buffer size 'on-the-fly', so
the actual buffer size set up front does not matter very much any more. So, the
'Buffering' value is the adaptive buffer size that IPJudo detected Windows is using.
The 'utilization' of this buffer should always be small.
|
Upload Statistics: The upload speed, server, ip address, RTT times, and buffer
sizes are displayed. In some cases, if your ISP is using a transparent web proxy,
the upload test may fail.
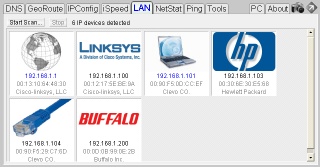
To auto-discover all of the IP devices on your local network, use the LAN Scan feature.
Quick Start: Press the 'Start Scan...' button and see what
IP devices are found on your local network.
Display:
The LAN Scan will attempt to find all IP connected devices on your local
network (which are turned on and operational).
The (1) IP Address, (2) MAC Address, and (3) MAC address OUI of each device found
is displayed graphically. A 'globe' designates the gateway. A 'laptop' designates
the local PC. If the OUI vendor is known, the logo of that vendor is displayed.
Otherwise, a 'RJ45 jack' designates a generic device found.
|
Even computers running personal firewalls blocking all access will be found.
|
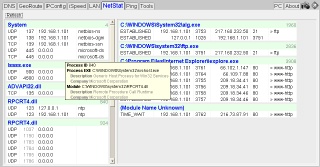
When you need to track down a TCP/UDP port/connection back to a process name, use NetStat.
Quick Start:
Press the 'Refresh' button to capture the state of all TCP/IP listening
ports and connections. Then, use the mouse to hover over the screen for details.
Listening Ports (left pane)
The left pane shows all listening TCP/UDP ports by process name. Use the mouse
to hover over a process name to obtain the full path to the exe. Hover over a
listening port for a detailed information popup.
Connections (right pane):
The right pane shows all TCP connections by process name. Use the mouse
to hover over a process name to obtain the full path to the exe. Hover over a
TCP/IP connection for a detailed information popup.
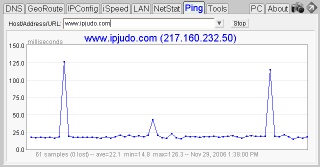
When you need to verify connection quality, over time, to a remote host, use Ping.
Host/Address/URL:
Just enter a Host name, IP Address, or URL into the text field and press 'Enter'
on your keyboard. The named host/ip address will be pinged on a regular basis,
with the real-time results displayed graphically.
Summary Information:
Ping summary statistics, like number of samples, lost packets, average ms time,
minimum ms time, and maximum ms time are displayed under the graph.
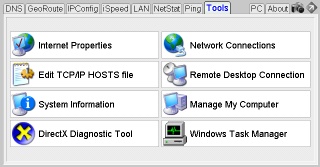
Common, useful tools for a network administrator are
in a menu for quick access.
Internet Properties:
A shortcut to the 'Internet Options' in the Control Panel.
Edit TCP/IP HOSTS file:
Edits the TCP/IP 'hosts' file, which allows you to
create local (private to the PC) 'host name to ip' mappings.
System Information:
Very detailed information about the entire computer and its resources.
DirectX Diagnostics Tool:
Detailed DirectX information, allowing you
to tune features, and test DirectDraw, Direct3D, DirectSound, DirectMusic,
DirectPlay, etc.
Network Connections:
A shortcut to the control panel 'Network Connections'.
Remote Desktop Connection:
A shortcut to the 'Remote Desktop' application, which allows you to view/control a remote computer.
Manage My Computer:
A shortcut to the Windows management tool.
Windows Task Manager:
A shortcut to the Windows task manager.
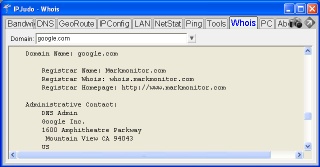
Find contact info for a Domain's owner.
Whois:
Discover domain contact information, like the 'Administrative Contact',
'Technical Contact', 'Zone Contact'.
Name Servers: Part of the domain record are the 'Name Servers' for the domain.
Dates: Most ofen you can also see the 'Created on' date for a domain,
as well as when the domain name expires.
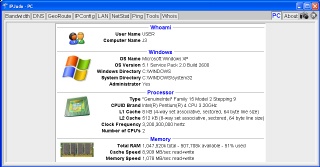
Displays various information about your PC.
Whoami:
Displays the 'User Name' and 'Computer Name'.
Windows:
Displays the OS name, version, build, directories, and an
'Administrator' test (Yes/No/Unknown).
Processor:
Displays the processor brand name, number, cache type/sizes,
processor clock frequency.
Memory:
Shows total RAM size, as well as main memory speed, and cache memory speed.
IPJudo:
Displays the IPJudo version, lets you know if there is an
update available, and shows/edits the product license key.
Java Runtime Environment:
Various information about the JRE
that IPJudo is currently using, and notifies you if an update
is possible/recommended.
Online Help:
Provides links to the IPJudo website for online help.
 Click on the 'Snap Picture' camera icon to snap an HTML report of the current tab.
Once you have the HTML report, print it, forward in an email, copy and paste
into a report, etc.
Click on the 'Snap Picture' camera icon to snap an HTML report of the current tab.
Once you have the HTML report, print it, forward in an email, copy and paste
into a report, etc.
 Click on the green arrow 'Full Screen' icon to have the IPJudo
application window utilize and entire Windows screen.
Click on the green arrow 'Full Screen' icon to have the IPJudo
application window utilize and entire Windows screen.
| |